Experience has shown that the Stress History parameter KD by DMT is considerably more sensitive to Stress History than other in situ tools. This sensitivity of KD is important, since stress history significantly reduces settlements and increases the liquefaction resistance. There are not many alternatives to KD for obtaining in situ information on stress history, especially in sand. On the other hand, in absence of adequate information on stress history, the benefits of stress history on stiffness and on liquefaction resistance are not felt and therefore ignored, leading to a more expensive design.
The first researcher to point out the higher sensitivity of DMT to stress history was Schmertmann (1984), who noted “the cone appears to destroy a large part of the modification of the soil structure caused by the overconsolidation and it therefore measures very little of the related increase in modulus. In contrast the lower strain penetration of the DMT preserves more of the effect of overconsolidation. Using the CPT to evaluate modulus changes after ground treatments may lead to a large overestimate of the settlement“.
The higher sensitivity to stress history (including aging) of KD, compared with the sensitivity of Qcn, has been confirmed by numerous researchers (e.g. Schmertmann et al. 1986, Jendeby 1992, Jamiolkowski and Lo Presti 1998, Monaco & Schmertmann 2007, Monaco and Marchetti 2007, Marchetti 2010, Kurek and Balachowsky 2015).
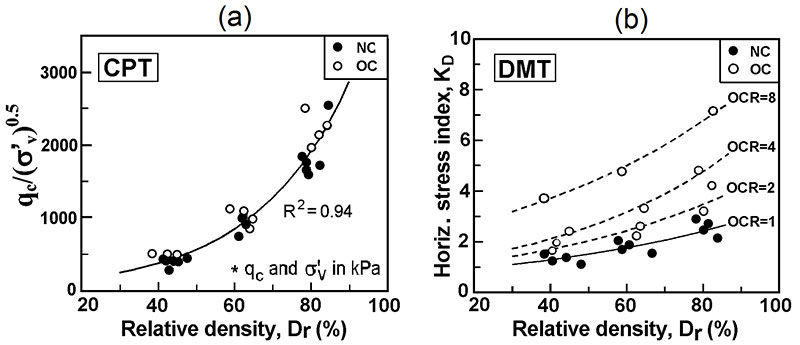
A comprehensive calibration chamber research project, specifically aimed at comparing the sensitivity of CPT and DMT to stress history, was carried out in Korea (Lee et al. 2011) on Busan sand. Fig. 1 compares the effects of stress history on Qcn and on KD obtained by executing CPT and DMT on normally consolidated and on overconsolidated sand specimens. The different increase in Qcn and in KD shown in the two diagrams highlights the much higher sensitivity of KD to Stress History.
The higher sensitivity of the DMT to Stress History emerges also when monitoring compaction, which is a way of imposing stress history. Schmertmann et al. (1986) noted in a compaction job “MDMT increased much more than Qc after the ground modification work, with an average MDMT gain about 2.3 times the Qc gain“. A similar gain ratio, higher than 2, was found by Balachowski and Kurek (2015).
Experience has shown that compaction increases both Qc and MDMT, but MDMT at a faster rate.
It is noted:
- qc reflects essentially Dr, and only to a minor extent OCR / stress history (see Fig. 1). (Though the qc–Dr relation is sand dependent).
- KD reflects the total effect of Dr plus various stress history effects such as OCR, aging, Ko, structure and possibly cementation (more on the effects of cementation).
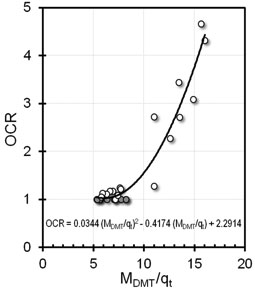
- Fig. 1 clearly shows that it is impossible to estimate OCR in sand from CPT alone or from DMT alone, i.e. shows the necessity of both qc and KD to evaluate OCR in sand. In fact Fig. 1(a) shows the low sensitivity of Qcn to OCR and Fig. 1(b) shows that if only KD is known and is entered in Fig. 1(b), its value could be due to a low relative density Dr and a high OCR or to a high Dr and a low OCR. In order to evaluate OCR, qc (well reflecting Dr) must also be available to provide an indication of Dr on the horizontal axis of Fig. 1(b). In conclusion both Qcn and KD are necessary to evaluate OCR in sand (Fig. 2).
- Stress History (reflected by KD) produces a small increase in penetration resistance, but a significant increase in CRR and in stiffness of a cohesionless soil.
- When OCR (or compaction) is applied, modulus increases much faster than strength. E.g. Yoshimi (1975): “Upon initial loading, the NC sand specimens were at least six times more compressible than the prestressed sand” or Lambrecht and Leonards (1978): “Prestressing increased the modulus by one order of magnitude, while Qc had only a slight increase“. Hence OCR (or compaction) cause an increase of the ratio MDMT/ Qc (Fig. 2). More information on estimating OCR in sand.