Liquefaction
Illustrated below are the today recommended methods for estimating by DMT the cyclic resistance ratio CRR in clean sand.
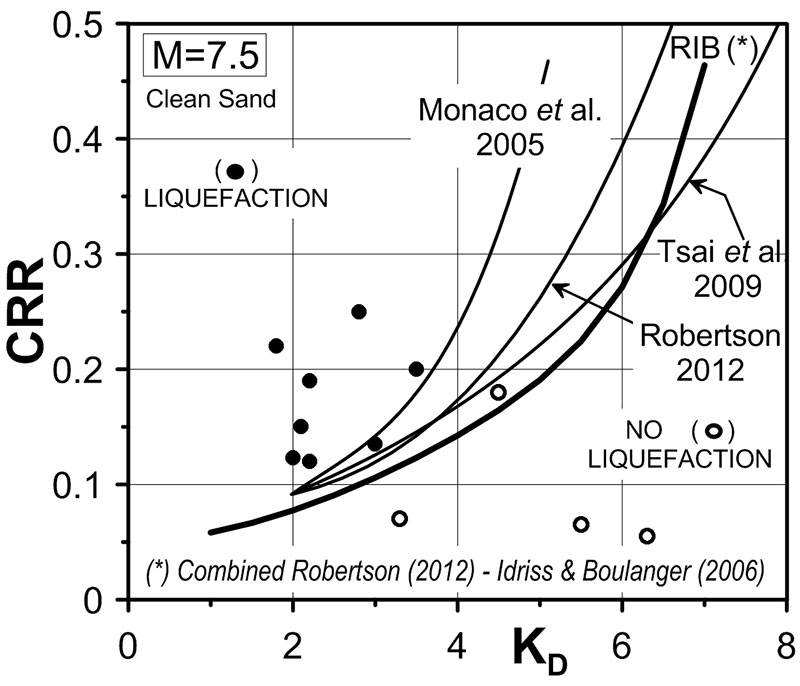
If only DMT results are available, then CRR can be estimated by correlations CRR=f(KD), as Fig. 1.
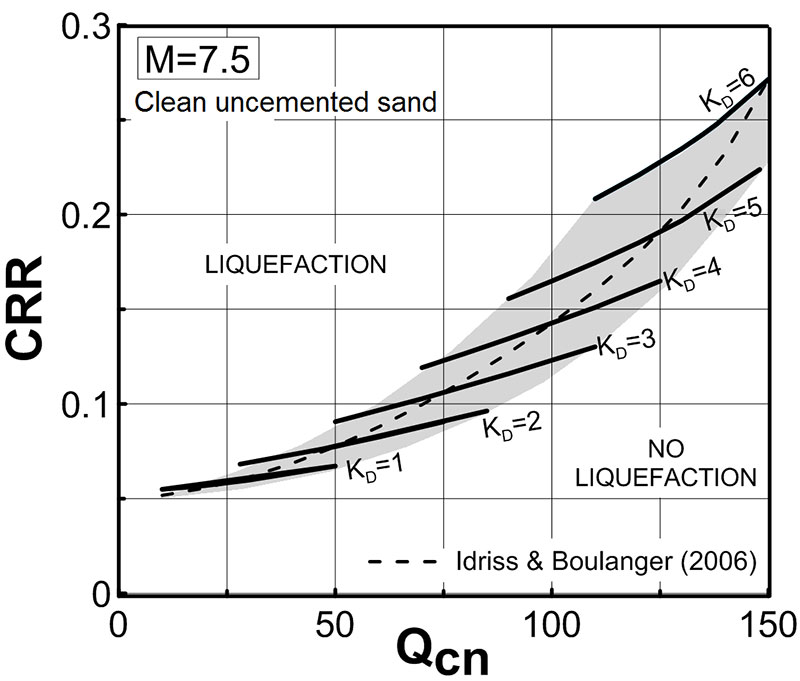
If, besides DMT, also CPT results are available, then CRR can be estimated by a correlation using both CPT and DMT results, namely a correlation CRR=f(KD, Qcn).
If SDMT is used, then another independent CRR evaluation can be obtained by a CRR=f(Vs) correlation.
CRR = exp [(Qcn /540)+ (Qcn /67)2 -(Qcn /80)3 + (Qcn /114)4 – 3] (1a)
with Qcn =25 KD (1b)
Eq. (1a) is the Idriss and Boulanger 2006 correlation to estimate CRR from Qcn.
Eq. (1b) is the Robertson 2012 average interrelationship Qcn ≈25 KD.
The combination of the two above Eqs. is plotted in Fig. 1 (curve labelled RIB).
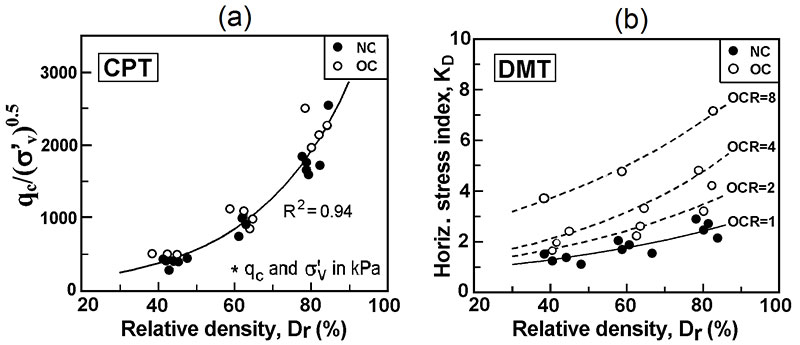
A recent paper (Marchetti 2016) proposes a method for incorporating Stress History into the liquefaction correlations. The method provides CRR estimates – in clean uncemented sands – based at the same time on Qcn and KD. The method stems from the combination of two well recognized notions: (a) Higher sensitivity of the DMT parameter KD to Stress History, compared with other probes (see e.g. Fig. 3, showing a considerably higher reactivity to OCR of DMT compared with CPT, or see Marchetti 2010); (b) Necessity of Stress History information to obtain proper estimates of the liquefaction.
The method, whose conclusion is the chart in Fig. 2, provides estimates of CRR, based on both Qcn & KD, in the form CRR=f (Qcn , KD). Details on the derivation can be found in Marchetti (2016).
It is expectable that estimates of CRR based on two parameters are better than estimates based on just one parameter.
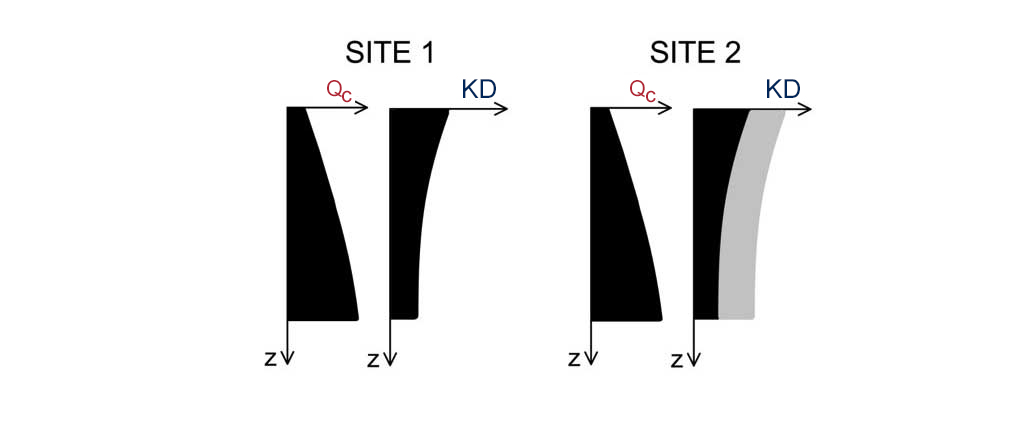
Note that, for a given value of Qcn , Fig. 2 predicts CRR values higher if KD is high, lower if KD is low. An example of the disparity of the estimated CRR – depending on KD – is schematically illustrated in Fig. 4, where two sites are represented, having the same Qcn, but different KD. Despite the equality of Qcn, Site 2 will have a higher liquefaction resistance than Site 1, because of the higher Stress History, as signalled by the higher KD.
For Qcn =100 and KD = 4, Fig. 2 provides CRR = 0.14. However, for the same Qcn =100, if KD =5, Fig. 2 provides CRR = 0.17. For the same Qcn, Fig. 2 provides CRR which are higher if KD is more than average (i.e. KD > Qcn /25) , are lower if KD is less than average.
In fact, since Qcn is scarcely sensitive to Stress History, Qcn will be similar in two sites which are equal except for Stress History, while KD will recognize the site having higher Stress History. Since Stress History increases the liquefaction resistance CRR, to a higher KD must correspond a higher CRR, for a given Qcn.
A similarity may be noted between liquefaction and settlements. In the settlement problem the modulus ED cannot be used as such, but must be “leveraged” by the stress history index KD. Similarly, according to Fig. 2, the liquefaction resistance CRR predicted by CPT cannot be used as such, but needs to be leveraged by KD.
The first studies on a CRR- KD relationship go back to nearly 3 decades ago (Marchetti 1982, Robertson & Campanella 1986). Subsequently, many additional correlations were proposed by various researchers (e.g. Reyna & Chameau 1991, Tsai et al. 2009). A description of the evolution of the correlation can be found in Monaco et al. 2005, who also presented a new correlation.
The latest KD -CRR correlations were developed as follows. The starting point was the CPT correlation Qcn -CRR. Then, using the average intercorrelation Qcn – KD, the Qcn parameter in the Qcn -CRR correlation was replaced by KD, thereby obtaining a correlation KD-CRR.
Note that the CPT correlation selected to obtain RIB (i.e. Eqns (1a) & 1(b) combined) has been Eq. (1a). The curve RIB (Fig. 1) is more conservative than Monaco’s.curve (Monaco has sometimes been indicated as a little unconservative).
One of the main reasons supporting the use of DMT to assess liquefiability is the significant sensitivity of the DMT’s parameter KD to Stress History – including aging, structure etc. (e.g. Monaco & Schmertmann 2007, Marchetti 2010, Marchetti 2015).Stress history is scarcely felt by qc and, in general, by cylindrical-conical probes (e.g. Huang & Ma 1994). On the other hand Stress History increases significantly CRR. If Stress History is not felt, and therefore ignored, Stress History benefits are wasted, leading to an uneconomical design.
Already in 1985 Jamiolkowski et al. (1985) had warned that “reliable predictions of liquefaction resistance of sands require the development of some new in situ device (other than CPT or SPT), more sensitive to the effects of past stress-strain histories”.
Fig. 3 above provides CRR estimates for clean uncemented sand, but no information in case of appreciable fines or cementation. A possibility to be explored could be the following. Convert Fig. 3 above into a diagram providing the % increase – based on Kd – to be applied to “the best CRR estimate by CPT” (a % diagram, rather than Fig. 3 providing a direct CRR estimate according to current correlations, that in future may be improved). Then apply this % correction factor to “the best CRR estimate by CPT”. The best CRR estimate by CPT is object of continuous improvement by researchers, including the fines correction. As CPT researchers improve “the best CRR estimate by CPT”, the CRR prediction would be automatically updated by applying the % factor to “the best CRR estimate by CPT” inclusive of the fines correction.
Idriss, Boulanger, Robertson, Cetin, Finn, Green, Stokoe, Mayne: “No laboratory tests are suitable for liquefaction estimation“. Only suitable field tests must be used.
Thesis (Univ. of South Carolina). The SPT, CPT, and Vs tests are all well-developed methods of estimating liquefaction potential. However the DMT is believed by many researchers to be a superior alternative. Due to the DMT’s minimal disturbance the test is able to detect minor changes in soil fabric and thus is sensitive to stress history, cementation, bonding and aging, all factors which increase liquefaction resistance. The current SPT and CPT based methods, which do not account for the effects of aging, underestimate the South Carolina Coastal Plain soil’s resistance to liquefy (e.g. cyclic resistance ratio (CRR)) by as much as 60%.
The cone appears to destroy a large part of the modification of soil structure caused by the overconsolidation and it therefore measures very little of the related increase in modulus. In contrast the lower strain penetration of the DMT preserves more of the effect of overconsolidation.
Use of Qc for evaluating CRR of natural sand subjected to a complex stress-strain history might appear questionable. Reliable predictions of sand liquefiability require some new in situ device [other than CPT or SPT] much more sensitive to the effects of past stress and -strain histories”.
OCR increases liquefaction resistance CRR, but changes negligibly Qcn.
CRR by CPT are adequate for low-risk projects. For high-risk: estimate CRR by more than one method.
Using CPT current correlations in old/ aged sands will, at best, result in very conservative and uneconomical design, at worst in very costly remedial measures or cancellation of a project.
Use 2 or more tests for a more reliable evaluation of CRR.
The allure of relying on a single approach (e.g. CPT-only) should be avoided.
Overconsolidation and aging are likely to have a much greater effect on increasing liquefaction resistance than they do on penetration resistance. Thus soils even lightly OC may have a greater resistance to liquefaction than indicated by the current SPT and CPT correlations, which are heavily weighted by data from hydraulic fills and very recent streambed deposits.