SDMT
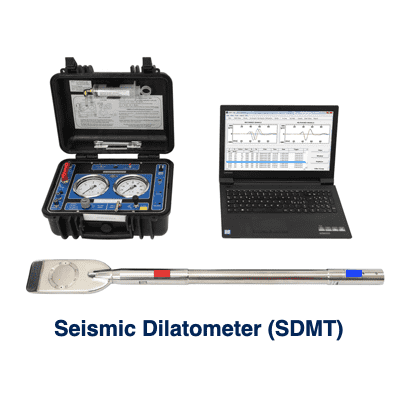
The seismic dilatometer is an add-on module that may be combined with the dilatometer or with the CPT for measuring the shear wave velocity Vs (SDMT) and compression wave velocity Vp (SPDMT)
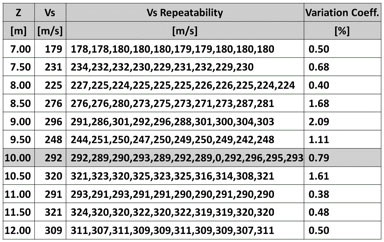
Thanks to the true-interval test configuration (two receivers), the repeatability of the VS measurements is very high, approximately 1 %, i.e. a few m/s.
The Vs values are calculated automatically and displayed in real time, at a cost and time considerably lower than Downhole or Crosshole.
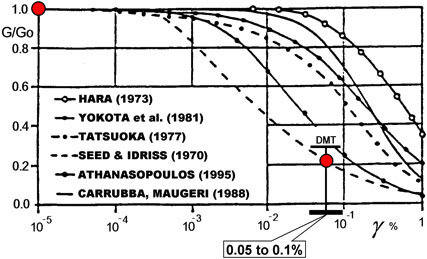
SDMT provides the small strain modulus Go and the working strain modulus MDMT, i.e. two points of the G-γ The availability of two points is helpful while selecting the design G-γ curve. (Amoroso et al. 2014).
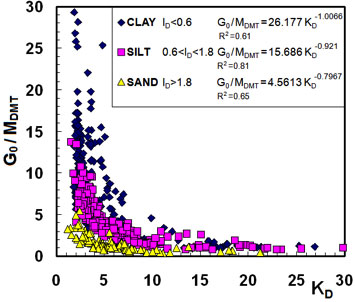
Based on SDMTs executed in many different soils and geographical regions, a chart (Fig. 5, Marchetti 2008) has been constructed permitting estimates of Vs from just mechanical DMT results.
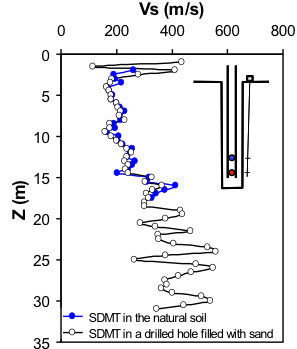
A Vs profile can be obtained in impenetrable soils by executing the test in a borehole backfilled with gravel (Fig. 7, Totani et al. 2009).
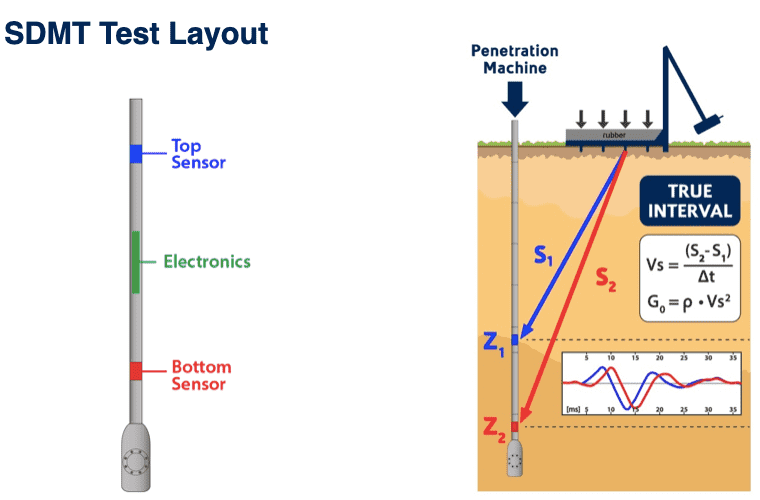
The SDMT is the combination of the flat dilatometer with an add-on seismic module for the measurement of the shear wave velocity. The seismic module (Fig. 1a) is a tubular element placed above the DMT blade, equipped with two receivers located at 0.5 m distance. When a shear wave is generated at surface, it reaches first the upper receiver, then, after a delay, the lower receiver.
The seismograms acquired by the two receivers, amplified and digitized at depth, are transmitted to a PC at the surface, that automatically calculates the delay using the Cross Correlation algorithm.
VS is obtained (Fig. 1b) as the ratio between the difference in distance between the source and the two receivers (S2 – S1) and the delay ΔT from the first to the second receiver.
The true-interval test configuration with two receivers avoids possible inaccuracy of the “zero time” at the hammer impact, sometimes observed in the pseudo-interval one-receiver configuration.
Moreover, the couple of seismograms recorded by the two receivers at a given test depth corresponds to the same hammer blow.
The repeatability of the VS measurements (see example in Table 1) is remarkable (observed VS repeatability » 1 %, i.e. a few m/s). The Vs values are calculated automatically and displayed in real time, at a cost and time considerably lower than Downhole or Crosshole.
Fig. 1c shows an example of seismograms obtained by SDMT at various test depths at the site of Fucino.
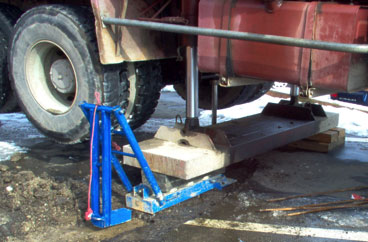
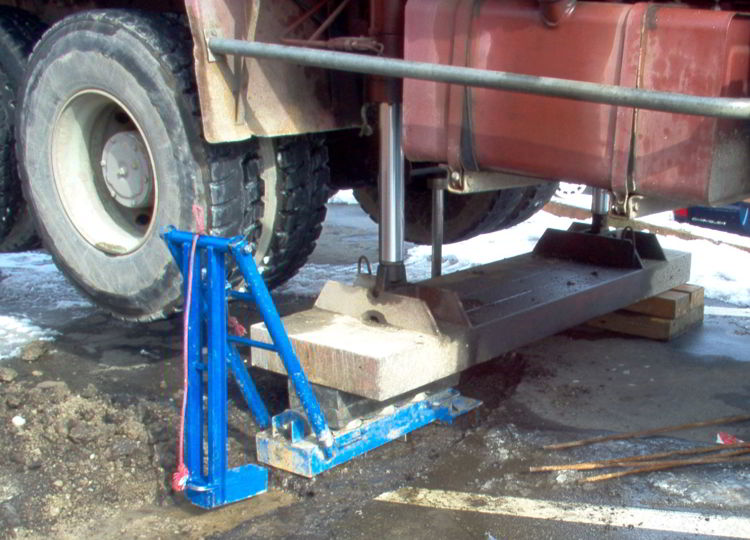
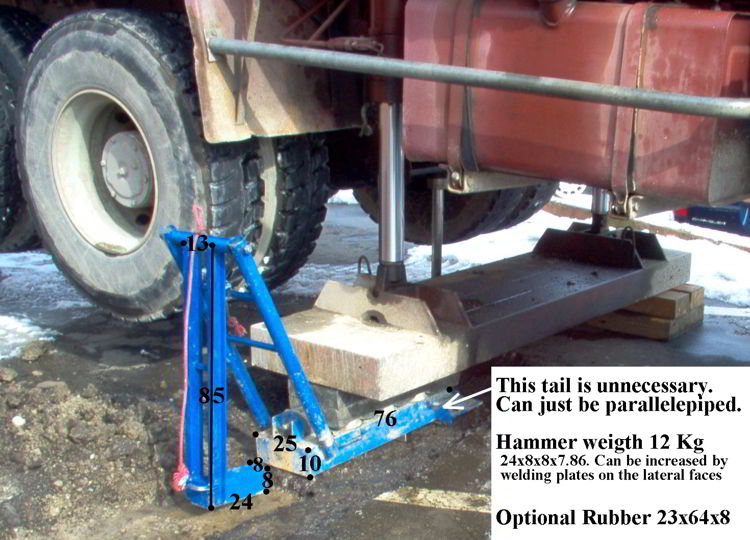
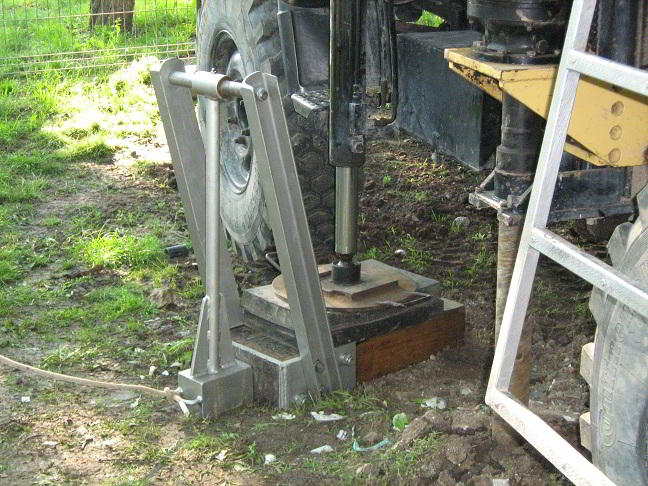
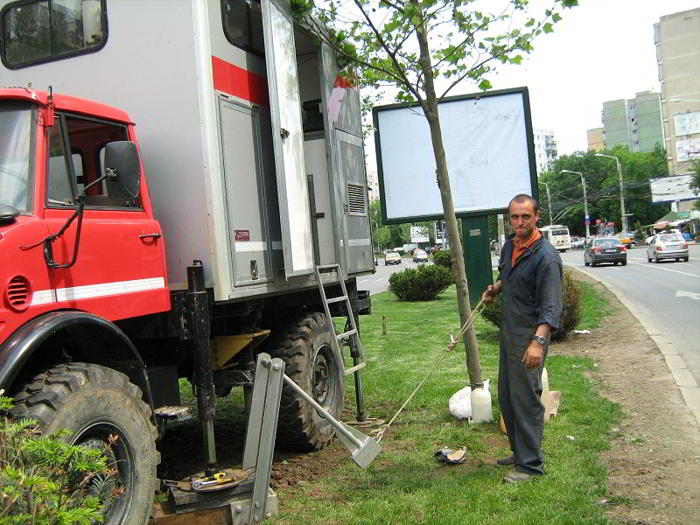
Fig. 2 shows a pendulum hammer generating the shear wave at ground surface.
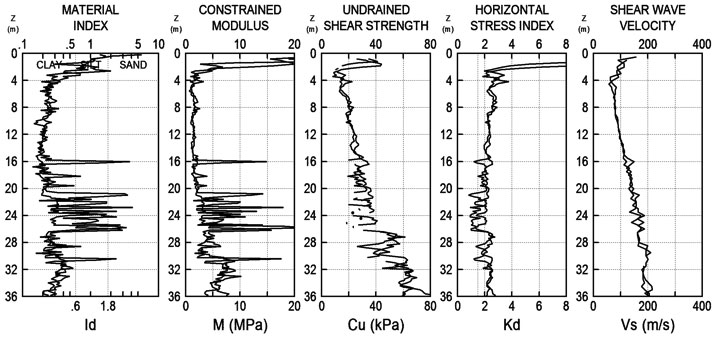
Shown in Fig. 3 are the profiles obtained from two adjacent soundings. The fifth profile is the VS profile obtained by the seismic module. It can be seen that the repeatability of VS in the two soundings is similar to the repeatability of the other four DMT parameters.
Table 1 shows the repeatability of Vs obtained from multiple hammer blows at a given depth, typically a couple of m/sec.
Fig. 4 shows the two points of the G-γ curve, namely the small strain modulus and the working strain modulus. They can be of help while selecting the design G-γ curve (Amoroso et al. 2014).
The chart in Fig. 5 has been constructed based on the results of 34 SDMT sites in numerous different soils and geographical regions. The chart can be used to obtain estimates of Vs from just mechanical DMT results, i.e. Vs = f(ID, KD, MDMT). It can be noted that the ratio Go/MDMT is highly variable. Hence it is not possible to estimate the operative modulus M by dividing Go by a constant, as it has been suggested sometimes.
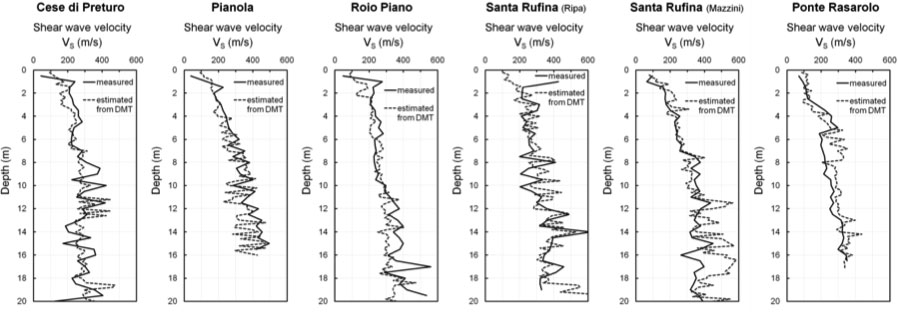
Fig. 6 shows a comparison between the Vs profiles measured by SDMTs and the profiles of Vs estimated from mechanical DMT data using the diagram in the previous Figure. Amoroso (2013) compares the DMT and CPT correlations for estimating Vs and concludes that Vs estimates based on DMT are closer to Vs measured.
In impenetrable soils VS profiles can be obtained by SDMTs carried out inside boreholes backfilled with gravel (Totani et al. 2009). The possibility of such measurement descends from the fact that the path of the shear wave from the surface to the upper and lower receiver includes a short path in the backfill of very similar length for both receivers. The backfilling material has to be clean coarse sand – fine gravel (grain size 2 to 12 mm, no fines), i.e. material sinking in the borehole without leaving cavities in the filling, that might later reduce the contact between the seismic probe and the soil. DMT measurements – meaningless in the backfill soil – are not taken in this case. Comparative tests at various sites indicate that the values of VS obtained in a backfilled borehole are nearly coincident with the VS obtained by penetrating the “virgin” soil (Fig. 7). See also Test Specifications SDMT (en/ita).
The Seismic test description and procedure is described in detail in the document: ASTM (2008). “D 7400-08 Standard Test Methods for Downhole Seismic Testing”. General information and guidelines can also be found in Butcher et. al. (2005).
A summary of the main recommendations for SDMT execution can be found in “DMT and SDMT Tests Specifications”.
In order to execute a seismic test (by SDMT), the membrane has to be closed, for completeness of the electrical circuit. Therefore, if the soil pressure is insufficient to close the membrane, the operator should apply a depression during the SDMT execution.
Additional information can be found in SDMT Specifications (en/ita).
Correct hitting direction: should be (at least approximately) perpendicular to the line from the rods to the center of the source.
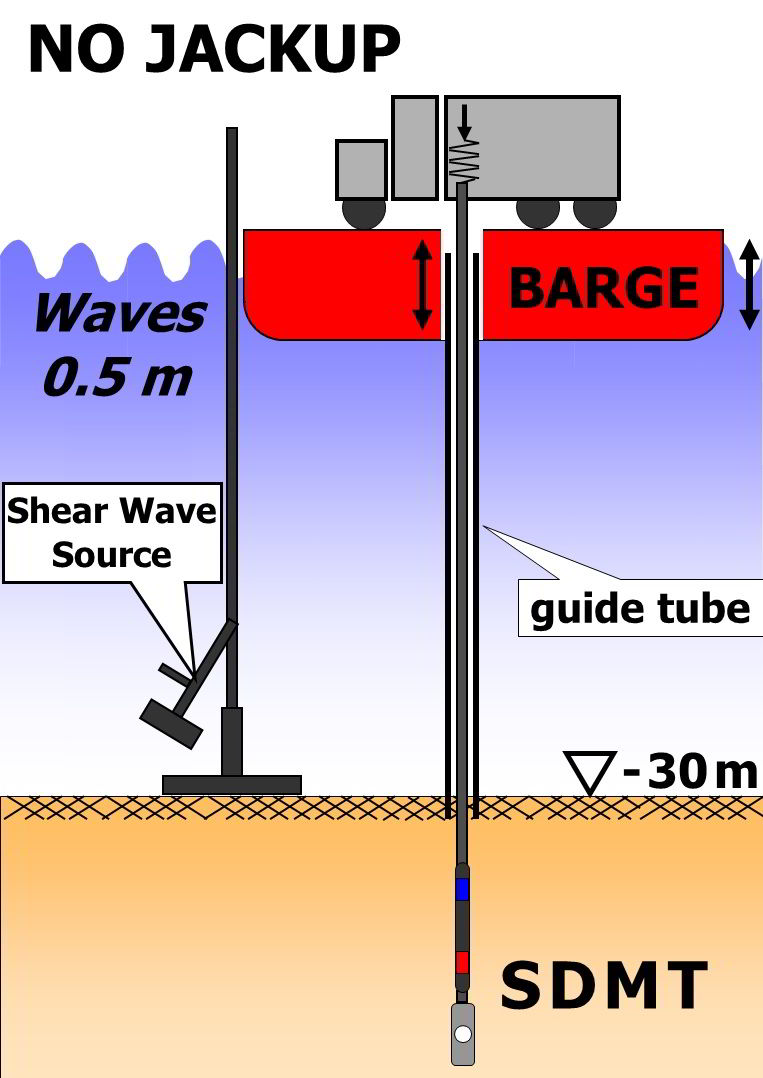
SDMT seismic measurements are possible also in offshore sites. A modified version of the shear wave source is lowered to the seafloor and is actioned from the operator at surface.
Measurements of Vs have been performed with a maximum water level of 50 m and at a maximum depth of 40 m below the seafloor.