Compaction Control

DMT has been recognized to be twice more sensitive than CPT to compaction (e.g. Schmertmann 1986, Balachowski 2015). Today before-after DMTs are increasingly used to monitor the gain in modulus and the gain in OCR.

As pointed out by Schmertmann (1986), a more rational design criterion is to establish a minimum modulus (e.g. MDMT ³ 80 MPa or more) rather than a minimum difficult-to-determine in situ Dr.
The compaction of a loose sandfill typically increases the ratio MDMT / qc (reflecting OCR) from MDMT / qc ≈ 5-12 (denoting OCR » 1) to a post-compaction value MDMT / qc ≈ 12-24 (denoting appreciable OCR).

Table of Contents
    Add a header to begin generating the table of contents

    Compaction control with DMT

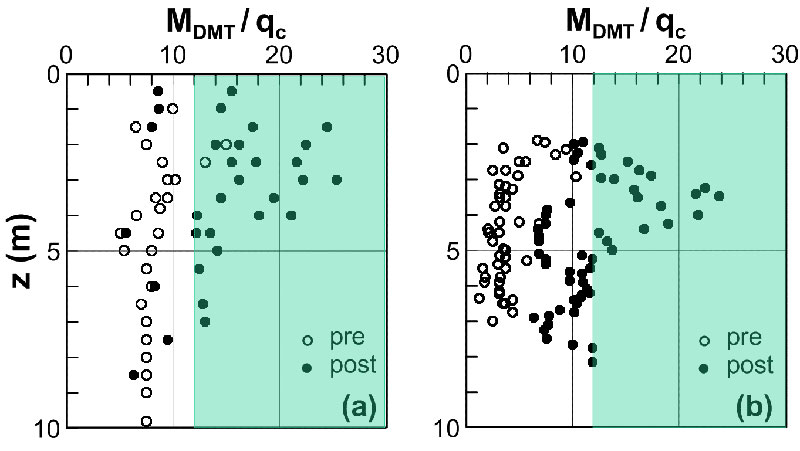
    The DMT has been frequently used to check the effectiveness of the compaction, by comparing DMT results before and after the treatment. The compaction is generally reflected by a substantial increase of KD and MDMT. Schmertmann (1986) found that the compaction produced an MDMT gain approximately twice the qc gain (note that the increase of MDMT is primarily due to the increase of KD). A similar trend was observed by Jendeby (1992) who found, upon compaction of a loose sandfill, an increase of the ratio MDMT / qc from a pre-compaction MDMT / qc ≈ 5-12 to a post-compaction MDMT / qc ≈ 12-24 (Fig. 2). The fact that MDMT / qc increases with compaction (note that compaction is a way of applying stress history) is due to the fact that OCR increases MDMT at a faster rate than qc (at least in quartz sands). These findings have been confirmed by many researchers, e.g. Balachowski 2015: “The post-treatment MDMT is on average 7.6 times higher than MDMT before compaction. The mean increase of MDMT within the compacted sandy layer is about 2.3 times higher than corresponding increase of qc “.

    Many designers like to know not only the gain in M, but also the gain in OCR due to the compaction. OCR in granular soils can be estimated from the ratio MDMT / qc   using the Monaco (2014) Eq. :

    OCR = 0.0344 (MDMT /qc)2 – 0.4174 (MDMT /qc) + 2.2914 (1)

    Profiles of OCR – or of its proxy MDMT / qc – are plotted (see examples in Fig. 1) when the designer needs to confirm the overconsolidated nature of the compacted fill (e.g. Sharif 2015). More details on the relationship MDMT / qc – OCR are given in section “OCR in sand”.

    Estimates of OCR – using the above formula – are of high interest to the designer. However (1) In calcareous sands, for example, the compaction, due to grain crushing, may transform the soil into a “pastalike” material, where the modulus increase is moderate, so that the above formula may not work   (2) Even more than in OCR the engineer is normally interested, for design, in the gain in modulus (and this is so even in calcareous sand).

    Note also that estimating OCR using Eq. 1 requires both DMT and CPT, while estimating M requires DMT alone. Thus M is not only the most useful, but also a simpler to obtain parameter. As to the reliability of MDMT, indications may be found here among citations by world experts on settlements.

    compaction control ocr
    Fig. 1. MDMT/ qc (a proxy of OCR) before and after compaction. When MDMT /qc ≥ 12, sand is appreciably OC. (a) Jendeby (1992) (b) Balachowski and Kurek (2015)

    In 1986 Schmertmann observed that, since the primary objective of the ground improvement is to limit settlements, it appears more rational to establish the acceptance criterion in terms of minimum modulus rather than of minimum Dr , as modulus relates more closely to the objective than Dr. In the job described by Schmertmann the designers replaced the qc to Dr criterion to a minimum MDMT acceptance criterion. Similarly Balachowski 2015 describes a compaction job where “the minimum average MDMT = 80 MPa was fixed as an acceptance criterion for the post-treated subsoil”. In that job it turned out that “ MDMT over the compacted soil strata exceeded by far the acceptance criterion”.


    A collateral advantage of using the minimum MDMT acceptance criterion is to avoid estimatng in situ Dr, often problematic. As pointed out by Robertson and Campanella (1983) Hilton Mines sand at Dr =60% has the same qc as Monterey sand at Dr =40% (see Figure below), i.e. there is no unique mapping qc to Dr applicable to all sands (Fig. 2).

    Fig. 2. Example of different correlations for interpreting Dr from qc. (Robertson and Campanella 1983).

    Case Histories

    DMT for Compaction Control - Palma Jumeirah Dubai

    SDMT for Measuring Soil Densification due to Ground Improvement in Christchurch, New Zealand

    DMT for Compaction Control in Belgium

    Other applications to design